Lactate, explained: The foundation of smarter endurance training
Lactate is one of the few internal markers that rises predictably with exercise intensity, which is why coaches and sport scientists measure it. It isn’t what makes you sore; it’s a normal by-product of anaerobic carbohydrate metabolism and a useful signal for setting training zones.
The physiology behind lactate
During exercise, the body’s energy demand increases, and more ATP is produced from carbohydrates.
First, glucose or glycogen is broken down through glycolysis, producing pyruvate. If oxygen supply and mitochondrial capacity are sufficient, pyruvate enters the mitochondria and is oxidised, this is called aerobic glycolysis.
When exercise intensity rises and glycolysis runs very fast, the mitochondria cannot process all the pyruvate immediately and we are entering the realm of anaerobic glycolysis. In this situation, pyruvate is converted into lactate. This step regenerates NAD⁺, which allows glycolysis to produce ATP at a higher rate.
Importantly, lactate accumulation is not a pathological overflow. It is a normal, well-regulated part of energy metabolism and helps the muscle continue to produce enough energy during high-intensity exercise.
Two facts follow from this:
Lactate is always produced. Even at low workloads and at rest blood will show ~1–2 mmol·L⁻¹ due to continuous production and clearance.
Lactate is continuously removed. Oxidative skeletal muscle fibres, myocardium, and the liver act as lactate consumers, oxidising lactate or converting it back to glucose (Cori cycle).
Blood lactate concentration therefore reflects the balance between whole-body lactate production and whole-body lactate clearance. Concentrations do not rise because lactate suddenly appears, but because production rate exceeds clearance rate.
A small capillary blood sample can indicate whether a workload can be produced solely with aerobic glycolysis, or if it needs additional anaerobic glycolysis, and thus where LT1 and LT2 sit for an individual.

The lactate curve
In a graded exercise test/incremental step test (e.g. cycling or running, 3–5 min per stage), blood lactate is sampled at the end of each stage and plotted against external load (power or speed). The relationship typically shows three functionally distinct segments:
Low-intensity, baseline segment. At low workloads, lactate remains close to resting values and the curve is nearly horizontal. The energy demand is low and oxygen delivery and mitochondrial oxidation comfortably match glycolytic flux. This is the zone targeted for extensive endurance training.
First systematic rise — LT1 / first lactate turn point. With further load, lactate begins to increase in a reproducible manner above baseline. This indicates the upper boundary of predominantly aerobic metabolism: lactate is being produced faster.
Steeper, exponential-like rise — LT2 / second lactate turn point. At higher loads, a second distinct acceleration of lactate accumulation appears. Here, production clearly outstrips clearance, and time to exhaustion drops sharply.
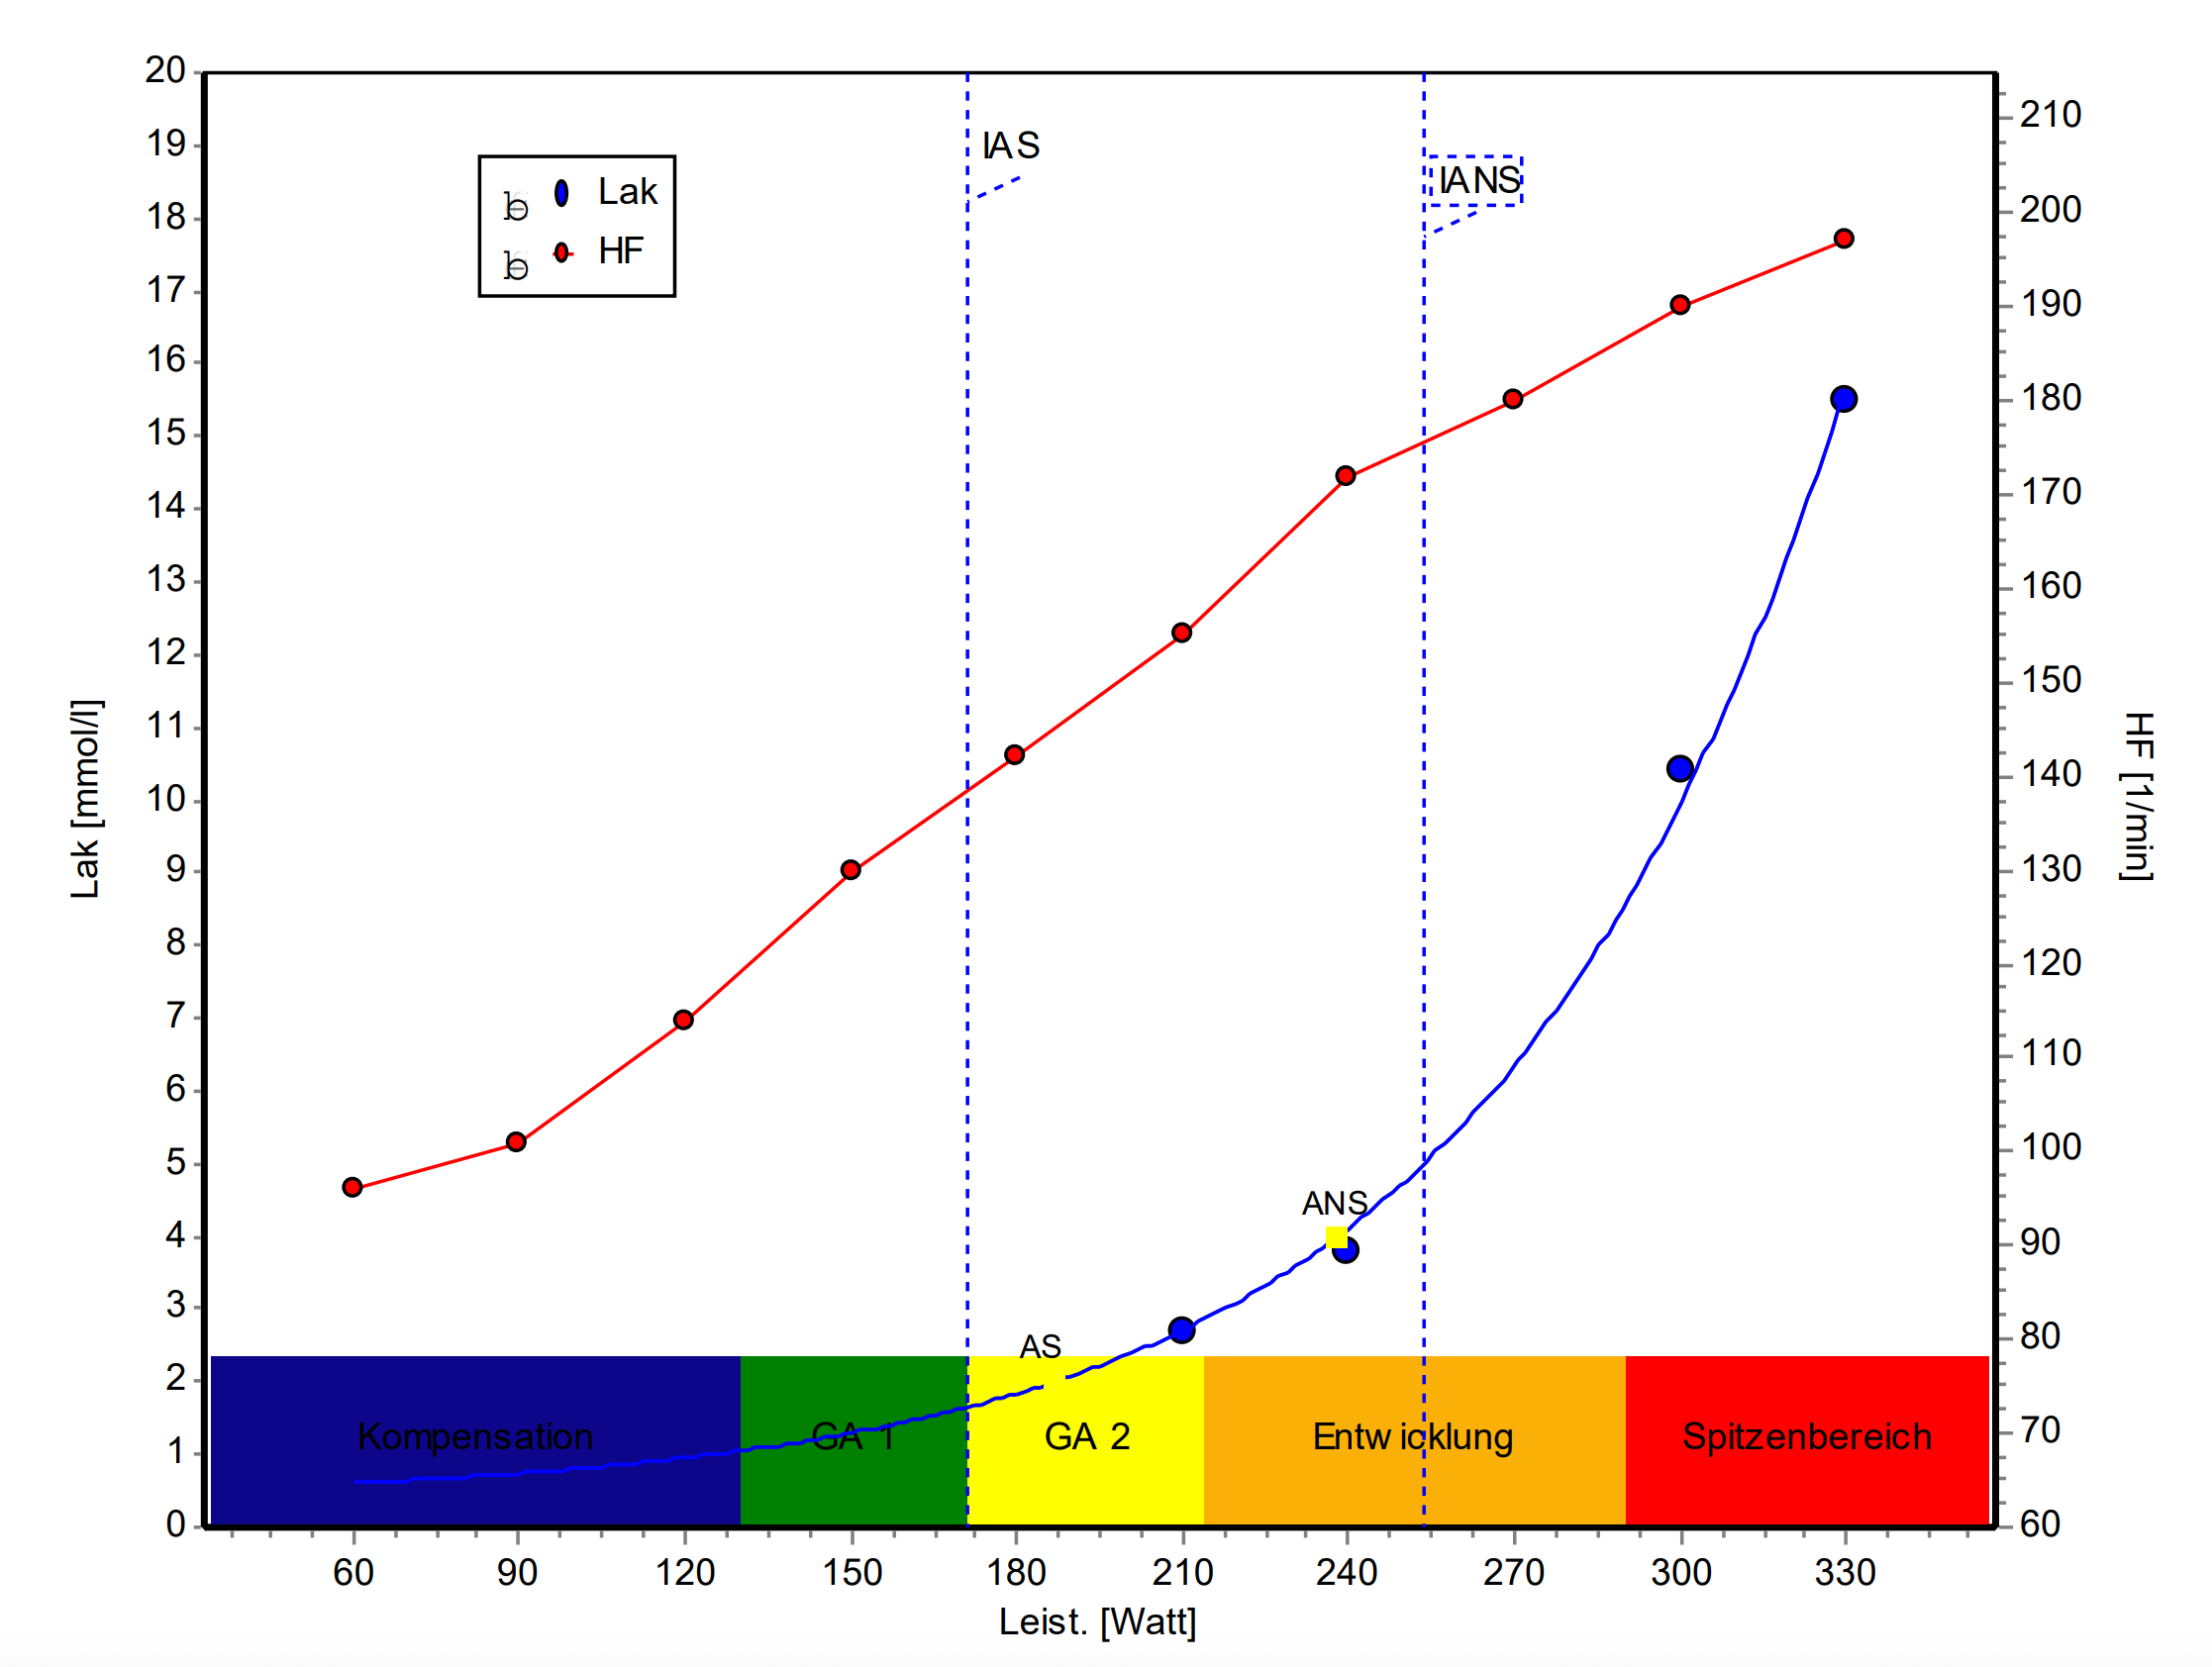
Initially, the exercise demand is fully matched by aerobic metabolism, making the effort sustainable and keeping the lactate curve flat. At the first threshold (IAS) it reaches the upper end of aerobic metabolism and suits steady, structured sessions. Indicated by a steep rise past the second threshold (IANS) it enters high intensity exercise where lactate accumulates and a steady state can no longer be maintained.
The next article will look at methods to collect lactate data.